Project 2: Covid-19 Cases Prediction
Apply your knowledge to build something amazing!
Project 2: Covid-19 Cases Prediction 🦠
ℹ️ Project Overview Difficulty Level: Intermediate
Estimated Time: 4-6 hours
Skills Practiced:
- Working with lists and dictionaries
- Creating and using functions
- Implementing mathematical models
- Data visualization basics
- Real-world problem solving
Overview
In this project, you will build a program to predict the new Covid-19 cases using the basic reproduction number (R0). R0 represents the average number of people who will catch the disease from one infected person. Your program will predict how the number of cases grows based on this factor. This project will enhance your understanding of lists, for loops, and functions in programming.
📋 Project Roadmap 🗺️
- Part One: Calculate Average R0 - Complete this step
- Collect Daily Case Data - Complete this step
- Calculate R0 for Each Day - Complete this step
- Find Average R0 - Complete this step
- Part 2: Predict Future Cases - Complete this step
- Create Prediction Model - Create and add prediction model
- Generate Daily Predictions - Complete this step
- Display Results - Complete this step
- Create Video Demo - Create and add video demo
- Submit Project - Submit your completed project
- Start: Understand R0 Concept - Begin your project
Project Components
This project involves coding a simple Covid-19 prediction model based on R0, and submitting a video demonstrating how your program works. There is no report required for this project.
Project Requirements 📝
⚠️ Critical Setup Before starting:
- Make a copy of the
Open in ColabGoogle Colab notebook
1RW79bqBCKRuds7dkvxo4bF42225JsS_b- Save it to your Google Drive
- Rename it with your name:
YourName_Covid19_Prediction.ipynb- Make sure you're logged into your Google account
One. Code Implementation 💻
- Platform: Any Python IDE (e.g., Google Colab, Jupyter Notebook, or local Python setup)
- Requirements:
- Basic Reproduction Number (R0): Understand and implement the basic reproduction number (R0) to predict how the disease spreads. The formula for predicting new cases is:
- New Cases = Previous Cases x R0
- Use of Lists: Use lists to track the number of cases for each day or iteration.
- For Loops: Create a loop to predict new cases for a certain number of days, based on the R0 value.
- Functions: Define a function to calculate and update the number of new cases based on R0, and another function to display the results for each day.
- Output: Display the prediction for each day, showing how the number of new cases increases over time.
- Basic Reproduction Number (R0): Understand and implement the basic reproduction number (R0) to predict how the disease spreads. The formula for predicting new cases is:
Example Features:
- Predict the number of new cases for 30 days.
- Start with an initial number of cases (e.g., 100 cases on day 1).
- Use an R0 value to calculate the growth of cases.
- Display the daily number of cases and total number of cases.
2. Video Submission
- Duration: 2-3 minutes
- Requirements:
- Record a video showing your Covid-19 prediction program running.
- Display input values like the initial number of cases and R0.
- Show the daily predictions of new cases.
- Explain how the R0 value impacts the spread of the disease and how your program uses it to predict future cases.
- Discuss any additional features or improvements you added to the project.
Evaluation Criteria
Your project will be evaluated based on the following criteria:
-
Code Functionality (50%)
- Proper implementation of R0 and the prediction model
- Correctly uses lists, for loops, and functions
- Accurate calculation of new cases and proper display of results
-
Code Quality (25%)
- Code is clean, well-organized, and easy to understand
- Includes clear comments explaining the logic and key parts of the code
-
Creativity and Features (15%)
- Additional features or enhancements, such as allowing the user to input their own R0 value or number of initial cases
-
Video Submission (10%)
- Clear and concise explanation of the project
- Demonstrates the program working correctly and provides insight into how it functions
Submission Requirements
Final submission should include:
- Python code file (e.g.,
.pyor notebook) - 2-3 minute video showing the project and explanation
Project Submission
Make sure to double-check your project before submitting. Ensure you have included the Python code file and the video explanation as required.
COVID-19 Prediction Project Guideline 🚀
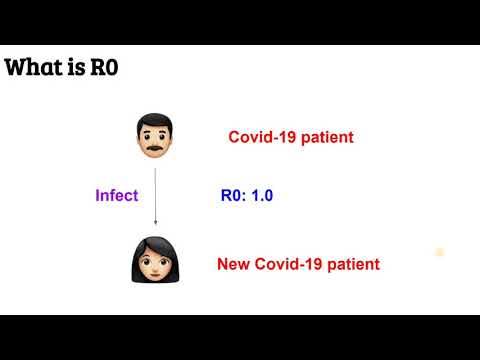
💡 Understanding R0 What is R0? Think of it like this:
- If R0 = 2.0, one infected person spreads to 2 people on average
- If `R0 < 1.0`, the outbreak will eventually die out
- If `R0 > 1.0`, cases will grow exponentially
In this project, you need to create a program to predict the new Covid-19 cases using R0. Click the link
Google Colab
1RW79bqBCKRuds7dkvxo4bF42225JsS_bTo predict the Covid-19 cases in Malaysia, the basic reproduction number (R0) of Covid-19 in Malaysia is used. In short, the R0 is a projection of how many people on average each new Covid-19 patient would infect.
Example:
- R0 for a husband to wife: 1.0
- R0 for a husband to wife and 1 child: 2.0
Important facts:
- The best R0 to control the number of cases is below 0.5.
- We had only 45 new cases on 11 September 2021, but the R0 was 2.34.
- Conditional Movement Control Order (CMCO) in Sabah, Selangor, Putrajaya and Kuala Lumpur has brought the R0 down to below 1.0
Disclaimer: In this project, R0 is predicted by the assumptions:
- The infection of Covid-19 happens exactly on the next day and the case is confirmed on that day as well.
- Hence, this prediction may vary from the real life cases. There are many factors to be considered for the prediction by professionals.
In general, this project will be divided into 2 parts:
- Part One: Calculate the average of R0 using the existing data
- Part 2: Predict the new cases and cumulative cases using R0 calculated
PART 1: Calculate Average R0 📊
📝 Milestone Checkpoint 1 ✅ Goal: Calculate the average R0 from historical data
⏱️ Time: ~1 hour
🎯 Success Criteria: Your program can calculate R0 from user-provided case data
Phase One: Declare the data needed 🗂️
- Create 2 empty lists with the name "data_cases" and "data_r0"
Phase 2: Ask and store the data 📥
💡 Common Error If you get a
ValueError, make sure to convert input to integer usingint()
- By using input(), ask "How many days of data do you want to insert?"
yaml
How many days of data do you want to insert? 3
Cases for 3 day(s) before:
1095
Cases for 2 day(s) before:
2188
Cases for 1 day(s) before:
1500
- Depending on the days inserted, use a for loop to:
- Print "Cases for",data_days - x, "day(s) before: " by using print() method.
- Ask for input on how many cases are for each day and store the value in a variable "day_case".
ini
day_case = int(input(""))
-
Store the day_case in the list "data_cases" using the .append() method.
-
Continue when 1st iteration, then calculate r0 using the formula:
day_r0 = today_cases / yesterday_cases
ini
if x == 0:
    continue
day_r0 = data_cases[x]/data_cases[x-1]
- Store the R0 calculated, day_r0 by 2 decimal places in the list "data_r0" using the .append() method. [Hint: round()]
Phase 3: Calculate the average of R0 🧮
⚠️ Important Make sure your
data_r0list is not empty before calculating the average!
- Define an average function to calculate the average of R0 as follows [Copy and paste]:
less
def average(data_r0):
   a = 0
   for b in data_r0:
     a += b
   return a / len(data_r0)
- Call the average function with the list "data_r0" as the argument. Store the value returned by the average function in a variable named "r0" with 2 decimal places. [Hint: average()]
Phase 4: Show the result
- Print the results of data_cases, data_r0 and r0 as follows:
yaml
How many days of data do you want to insert? 3
Cases for 3 day(s) before:
1095
Cases for 2 day(s) before:
2188
Cases for 1 day(s) before:
1500
Data Cases: [1095, 2188, 1500]
Calculated r0: [2.0, 0.69]
Average of r0: 1.34
Remarks: More days of data leads to more accurate prediction of R0.
PART 2: Predict Future Cases 🔮
📝 Milestone Checkpoint 2 ✅ Goal: Use calculated R0 to predict future cases
⏱️ Time: ~2 hours
🎯 Success Criteria: Your program generates daily predictions with varying R0
Phase One: Declare the data needed for Day 0 📅
- Create a nested data structure with the name "predict" and keys "new_cases", "cum_cases", and "r0" as lists.
ini
predict = {
    "new_cases":[data_cases[-1]],
    "cum_cases":[data_cases[-1]],
    "r0":[r0]
}
Day 0 is started with the data of the last day inserted and the average of r0 calculated
Phase 2: Ask for days to predict
- By using input(), ask the user "How many days do you want to predict?"
ini
predict_days = int(input("How many days do you want to predict? "))
Phase 3: Predict the cases for the days 🔄
💡 Debugging Tip If predictions seem too high or low:
- Check your R0 calculation
- Verify the random range is +/-0.1
- Make sure you're using the correct index in lists
- Depending on the days inserted, use a for loop to:
- Import the package "random" and define the function to get a random r0 with the range +- 0.1. [Copy and paste]
lua
import random
def randomr0(r0):
   if random.random() > 0.5:
     r0 = r0 + 0.1 * random.random()
   else:
     r0 = r0 - 0.1 * random.random()
   return r0
- Call the randomr0() function with the variable "r0" as the argument. Store the value returned by the randomr0 function in a variable named "new_r0" in 2 decimal places.
ini
new_r0 = round(randomr0(r0), 2)
-
Calculate new case by using the formula as follows:
new_case = yesterday_newcases * new_r0
css
new_case = int(predict["new_cases"][i] * new_r0)
-
Calculate cumulative case by using the formula as follows:
cum_case = yesterday_cumcases + new_case
css
cum_case = predict["cum_cases"][i] + new_case
Phase 4: Store the data
- In the loop, store the data as follows:
- Store the new_case in the dictionary predict["new_cases"] using .append() method.
- Store the cum_case in the dictionary predict["cum_cases"] using .append() method.
- Store the new_r0 in 2 decimal places in the dictionary predict["r0"] using .append() method.
Phase 5: Show the result
- In the loop, print the results of new_cases, cum_cases and new_r0 for each day as follows:
bash
print("Predict Day", i+1, "- new:", new_case, "cum:", cum_case, "r0:", new_r0)
sql
How many days do you want to predict? 10
Predict Day 1 - new: 2040 cum: 3540 r0: 1.36
Predict Day 2 - new: 2590 cum: 6130 r0: 1.27
Predict Day 3 - new: 3470 cum: 9600 r0: 1.34
Predict Day 4 - new: 4580 cum: 14180 r0: 1.32
Predict Day 5 - new: 6595 cum: 20775 r0: 1.44
Predict Day 6 - new: 8243 cum: 29018 r0: 1.25
Predict Day 7 - new: 11787 cum: 40805 r0: 1.43
Predict Day 8 - new: 16855 cum: 57660 r0: 1.43
Predict Day 9 - new: 21911 cum: 79571 r0: 1.3
Predict Day 10 - new: 27388 cum: 106959 r0: 1.25
Debugging Tips 🐛
Common Errors and Solutions:
-
IndexError: list index out of range
- Check that you're starting loops at the correct index
- Remember lists start at index 0
-
ValueError: invalid literal for int()
- Make sure to convert string inputs to integers
- Add error handling for invalid inputs
-
ZeroDivisionError
- Check that previous day cases are not 0
- Add validation for input data
Testing Your Code:
graphql
# Test with small numbers first
# Example: 3 days with cases [100, 150, 200]
# Expected R0: [1.5, 1.33], Average: 1.42
Extension Challenges 🌟
Challenge One: Data Visualization (Beginner)
Add a simple bar chart showing daily cases using matplotlib:
python
import matplotlib.pyplot as plt
# Plot your predictions
Challenge 2: Multiple Scenarios (Intermediate)
Modify your program to show three scenarios:
- Best case (R0 - 0.3)
- Expected case (calculated R0)
- Worst case (R0 + 0.3)
Challenge 3: Realistic Spread Model (Advanced)
By the assumption that the infection of Covid-19 happens randomly on any day within 2 weeks, predict the new cases for one month.
Example:
- Day 1 is 100 cases with R0 1.5. The new case will be 150.
- It randomly happens in the coming 14 days.
- Hence the new cases from day 1 might be:
- Day 2 - 20, Day 3 -10, ..., Day 15 - 5 (in total 150 cases)
- Similarly, for new cases for Day 2 and others.
📝 Final Milestone ✅ Goal: Complete project and create video demo
⏱️ Time: ~1 hour
🎯 Success Criteria:
- Code runs without errors
- Predictions are reasonable
- Video clearly explains your solution
Videos 📹


AI Prompt 🤖
Code with AI: Try using AI for project-related tasks.
Prompts:
- "Suggest Python libraries for visualizing data related to a simulation."
- "Help me create a Python function to simulate the spread of a virus based on certain parameters."
- "How can I add error handling to my COVID-19 prediction model?"
- "Show me how to create a line graph of predicted cases over time."
💡 Pro Tip Remember to test your code with different R0 values to understand how they affect the spread!