Concept 7: Classification
Classification
:dart: Learning Objectives
By the end of this lesson, you will be able to:
- Understand what classification is and how it works
- Identify real-world classification problems
- Implement three major classification algorithms: KNN, Decision Tree, and Naive Bayes
- Train and test classification models using Python
- Evaluate model accuracy and make predictions
:information_source: Classification is a supervised machine learning algorithm used to predict which category or class something belongs to.
Classification is one of the two major types of supervised machine learning algorithms (the other is Regression).
:star2: Real-World Examples
We use classification every day! Here are some examples:
- Email filtering: Sorting emails as spam or not spam
- Emotion detection: Identifying if a person is happy or sad from their face
- News categorization: Grouping articles into topics like sports, politics, or entertainment
:bulb: Classification works by finding patterns in features (characteristics) to group things correctly.
Let's see how this works:
We can tell if someone is happy by looking at their facial expression. Check out this example:
Humans naturally recognize these patterns. But computers need special algorithms to learn these patterns!
:books: Three Major Classification Algorithms
In this lesson, we'll explore three powerful classification algorithms:
K-Nearest Neighbor (KNN) - Classifies based on nearby examples
Decision Tree Algorithm - Makes decisions like a flowchart
Naive Bayes Algorithm - Uses probability to make predictions
:emoji: K-Nearest Neighbor (KNN) Algorithm
How KNN Works
First, we need a labeled dataset (data with known categories).
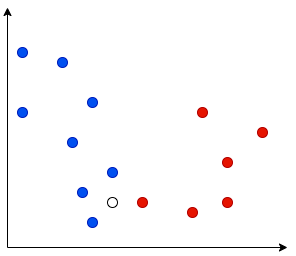
Let's say we have data with 2 classes. We plot each data point on a graph:
- Blue dots = Class A
- Red dots = Class B
We use this data to train our KNN model:
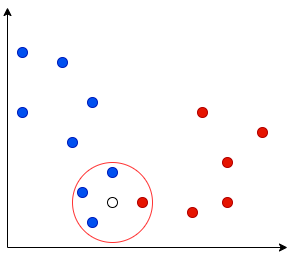
note Testing the Model: After training, we test with new data. The white dot (center of circle) is our test point. The model finds the nearest data points (called "neighbors") to decide which class it belongs to.


The number of neighbors checked depends on the K value.
What is "K" in KNN?
K = the number of neighbors we check when classifying new data.
For example, when K=4, we look at the 4 nearest neighbors:
In this example, 3 out of 4 neighbors belong to Class A. So we classify the new point as Class A too!
Choosing the Right K Value
:bulb: The K value affects how your model makes decisions:
- Small K values (like K=1): Each neighbor has more influence
- Pro: Captures fine details
- Con: Can be affected by noise
- Large K values (like K=10): Looks at more neighbors
- Pro: More stable predictions
- Con: Might miss important details


:emoji: Decision Tree Algorithm
:information_source: Decision Tree creates a flowchart-like model that makes decisions step by step, just like how you might decide what to wear based on the weather!
Decision Trees are one of the best classification algorithms because they're easy to understand and visualize.
Understanding the Tree Structure
Think of a Decision Tree as an upside-down tree:


Key Components:
- Nodes: Each decision point in the tree
- Root node: The starting point at the top
- Parent-Child relationship: How nodes connect to each other
- Leaf nodes: The final decisions (no more branches)
How to Build a Decision Tree
Step 1: Prepare your dataset
Step 2: Build the tree by asking questions about features
Step 3: Test the model with new data
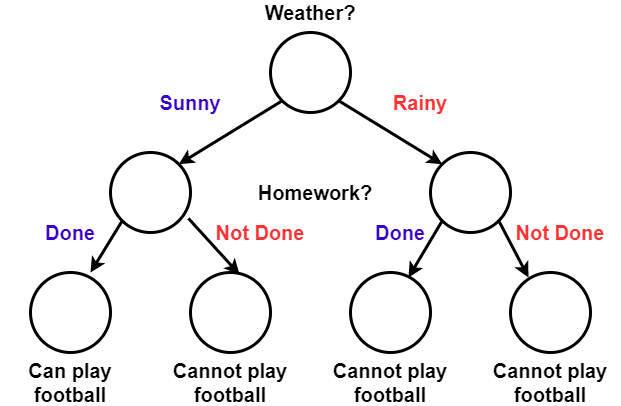
Let's see a fun example! Should we play football today?
| Weather? | Homework? | Play Football |
|---|---|---|
| Sunny | Done | Yes :white_check_mark: |
| Sunny | Not Done | No :x: |
| Rainy | Done | No :x: |
| Rainy | Not Done | No :x: |
The Decision Tree learns from this data:
:memo: Want to learn more? Check out this resource: Decision Tree Guide
:emoji: Naive Bayes Algorithm
:information_source: Naive Bayes uses probability to make predictions. It's called "naive" because it assumes each feature is independent (doesn't affect other features).
Let's understand this with a simple example:
Look at this apple. It has:
- Red color
- Round shape
Naive Bayes considers each feature separately. It asks:
- "What's the chance a red fruit is an apple?"
- "What's the chance a round fruit is an apple?"
How Probability Works
tip Probability = How likely something is to happen (from 0 to 1)

- 0 = Never happens
- 0.5 = Happens half the time
- 1 = Always happens
Let's see how Naive Bayes calculates probabilities:
| Color | Shape | Apple? |
|---|---|---|
| red | round | Yes :white_check_mark: |
| orange | round | No :x: |
| yellow | round | No :x: |
Example calculation:
- 3 fruits are round
- Only 1 round fruit is an apple
- Probability = 1/3 = 0.33 (33% chance)
So if we see a new round fruit, there's a 33% chance it's an apple and 67% chance it's not.
:memo: Learn more about Naive Bayes: Naive Bayes Guide
:computer: Implementation in Python
Now let's code these algorithms!
:bar_chart: Preparing the Dataset
First, we need to format our data correctly:
:information_source: Two parts needed:
- Features (X) - The characteristics we measure
- Labels (y) - The categories we want to predict
Features - Use 2D numpy array or Pandas DataFrame:
pythonX = np.array([[0], [1], [2], [3], [4], [5], [6], [7], [8], [9], [10], [11], [12], [13]])Labels - Use 1D numpy array or Pandas Series:
pythony = np.array([0, 0, 1, 1, 0, 0, 0, 1, 1, 1, 1, 0, 1, 0])tip If your data is 1D, reshape it to 2D:
python
X = np.array([0, 1, 2, 3, 4, 5, 6, 7, 8, 9, 10, 11, 12, 13])
X = X.reshape(-1,1)  # Makes it 2D
:emoji: Creating a K-Nearest Neighbor Classifier
Step 1: Import and create the classifier
python
from sklearn.neighbors import KNeighborsClassifier
clf_knn = KNeighborsClassifier()
Step 2: Set the K value (optional)
python
from sklearn.neighbors import KNeighborsClassifier
clf_knn = KNeighborsClassifier(n_neighbors=3)  # K = 3
:emoji: Creating a Decision Tree Classifier
Step 1: Import and create the classifier
python
from sklearn.tree import DecisionTreeClassifier
clf_dt = DecisionTreeClassifier()
Step 2: Add random_state for consistent results (optional)
python
from sklearn.tree import DecisionTreeClassifier
clf_dt = DecisionTreeClassifier(random_state=33)  # Same tree every time
:emoji: Creating a Naive Bayes Classifier
Choose the right type based on your data:
Option One: BernoulliNB - For 2 categories (binary classification)
python
from sklearn.naive_bayes import BernoulliNB
clf_nb = BernoulliNB()
Option 2: MultinomialNB - For multiple categories
python
from sklearn.naive_bayes import MultinomialNB
clf_nb = MultinomialNB()
:dart: Training the Model
This is where the magic happens! Scikit-learn makes it super easy - just one line of code!
:memo: The
fit()function teaches the model to recognize patterns in your training data.
For KNN:
pythonclf_knn.fit(x_train, y_train)For Decision Tree:
pythonclf_dt.fit(x_train, y_train)For Naive Bayes:
pythonclf_nb.fit(x_train, y_train):emoji: Testing the Model
Time to see how well our model learned!
We test using:
- x_test: New data to classify
- y_test: The correct answers
Example: Is someone happy or sad?
Shape of Mouth Tears Model's Guess Correct Answer ) no happy :white_check_mark: happy ) yes happy :white_check_mark: happy ( yes happy :x: sad ( no sad :white_check_mark: sad The model got 3 out of 4 correct = 75% accuracy!
Checking Accuracy
Use the
score()function to calculate accuracy:For KNN:
pythonclf_knn.score(x_test, y_test)For Decision Tree:
pythonclf_dt.score(x_test, y_test)For Naive Bayes:
pythonclf_nb.score(x_test, y_test)Example output:
text0.98This means 98% accuracy - the model got 98 out of 100 predictions correct! tip Try different classifiers to see which works best for your data. Each algorithm has its strengths!
Making Predictions
Want to classify new data? Use the predict() function:
For KNN:
python
clf_knn.predict([sample_data])
For Decision Tree:
python
clf_dt.predict([sample_data])
For Naive Bayes:
python
clf_nb.predict([sample_data])
:memo: Note Remember: sample_data must be in 2D numpy array format!
:memo: Summary
Let's recap what we learned about classification:
Key Concepts:
- Classification predicts which category something belongs to
- KNN looks at nearest neighbors to make decisions
- Decision Trees create flowchart-like rules
- Naive Bayes uses probability calculations
Python Steps:
- Prepare your data (X and y)
- Create a classifier
- Train with
fit() - Test accuracy with
score() - Make predictions with
predict()
:movie_camera: Video Tutorial

:emoji: AI Learning Prompts
Try these prompts with AI to deepen your understanding:
For Beginners:
- "Explain K-Nearest Neighbors using a simple analogy"
- "Show me a basic Decision Tree example with fruits"
For Practice:
- "Write Python code to classify iris flowers using KNN"
- "Create a Decision Tree to predict weather"
For Advanced Learning:
- "Compare accuracy of KNN vs Decision Tree on the same dataset"
- "Explain how to choose the best K value for KNN"
:dart: Practice Challenges
- Easy: Create a classifier to identify cats vs dogs based on weight and height
- Medium: Build a Decision Tree to predict student grades based on study hours
- Hard: Compare all three algorithms on a real dataset and explain which works best
Remember: The best way to learn is by doing. Start coding and experimenting!