Project 4: Google Play Store
Apply your knowledge to build something amazing!
Project 4: Google Play Store Analysis
:information_source: Project Overview :bar_chart: Difficulty Level: Intermediate
⏱️ Estimated Time: 6-8 hours
:hammer_and_wrench: Skills Practiced:
- Data cleaning and preprocessing with Pandas
- Data analysis and grouping operations
- Data visualization with Matplotlib
- Report writing and presentation skills
- Video communication of technical findings
:dart: Project Goals
This project focuses on analyzing Google Play Store data to extract meaningful insights and generate a comprehensive report. You'll work with real-world data to identify top-performing apps and categories, practicing essential data science skills along the way.
:emoji:️ Project Roadmap
scss
📥 Data Collection → 🧹 Data Cleaning → 📊 Analysis → 📈 Visualization → 📝 Report → 🎥 Video
     (Week 1)           (Week 1)         (Week 1)      (Week 1)       (Week 2)    (Week 2)
Project Timeline
| Week | Focus |
|---|---|
| L18 | Dataset Analysis, Initial Findings |
| L19 | Report Writing, Video Submission |
:clipboard: Project Components
One. :computer: Code Implementation
- Platform: Google Colab Notebook
- Requirements:
- Analyze Google Play Store data from the provided CSV file
- Identify the top 10 most installed free apps with the highest number of reviews
- Determine the top 5 categories with the highest number of installed apps
- Perform necessary data cleaning and manipulation
- Create visualizations where applicable to support the findings
:warning: Critical Setup Instructions :warning: Before you start coding:
- Download the
googleplaystore.csvfile from Kaggle- Make a copy of the provided Colab template - do NOT work in the original file
- Upload the CSV file to your Colab environment
- Ensure all required libraries (Pandas, NumPy, Matplotlib) are imported
2. :memo: Analysis Report
- Format: Google Docs (or equivalent)
- Requirements:
- Cover/Title: Include the title of the project
- Overview/Introduction:
- Background of the Google Play Store dataset
- Clear definition of project objectives
- Results (minimum 2 distinct results):
- At least one figure showing the top 10 apps
- At least one figure showing the top 5 categories
- Observations and insights based on results
- Supporting interpretation and analysis
- Conclusion:
- Summarize the findings
- Offer recommendations based on the analysis
- Discuss potential improvements and areas for further investigation
- References: Include credible sources for data interpretation and additional context
3. :movie_camera: Video Submission
- Duration: 2-3 minutes
- Requirements:
- Record a short video explaining your project and report
- Highlight key findings and visualizations
- Provide context for the analysis, focusing on why these results matter
- Demonstrate your understanding of the data and the methodology used in the project
:bar_chart: Evaluation Criteria
-
Code Quality (25%):
- Code is clean, well-organized, and correctly implements required techniques
- Efficient use of functions, loops, and libraries for data manipulation
-
Analysis Report (30%):
- Clear structure with an introduction, results, and conclusion
- Proper use of visualizations to support findings
- Depth of insights derived from the data
-
Results & Insights (20%):
- Relevance and significance of results
- Clear interpretation of the data
-
Video Submission (25%):
- Clear explanation of the project and results
- Well-organized, concise presentation
- Demonstrates understanding of the data analysis process
:package: Submission Requirements
Final submission should include:
- Google Colab notebook(s) with all code and analysis
- Complete report document
- 2-3 minute video explaining and showing the project
- Any supplementary materials referenced
:bulb: Before Submitting :white_check_mark: Double-check that your Colab notebook runs without errors
:white_check_mark: Ensure all visualizations are clearly labeled
:white_check_mark: Verify your report includes all required sections
:white_check_mark: Test your video for audio and visual clarity
:rocket: Project Submission
Please double-check your project before submitting it. Ensure you have included the Python code file, Report, and video explanation as required.
:link: Submit your project here
:books: Project 4: Google Play Store Guideline
Complete the following project. Google Playstore Colab File
:warning: Important Reminders :emoji: Critical Steps:
- Please make a copy of the colab file before you do the coding
- Make sure to do the project within the copy you just made, NOT in the template file
- Save your work frequently to avoid losing progress
:clipboard: Description
In this project, you will analyze the Google Play Store dataset (googleplaystore.csv) to meet specific data cleaning, data analysis, and data visualization objectives.
You will perform data wrangling, find top apps and categories based on installs and reviews, and create basic graphs.
:dart: Objectives
- Find the Top 10 most installed free apps with the highest number of reviews.
- Find the Top 5 categories with the highest number of installed apps.
:emoji: Part One: Setup and Data Cleaning
Step One: Import Required Packages
- Import Numpy and Pandas.
Step 2: Upload Dataset
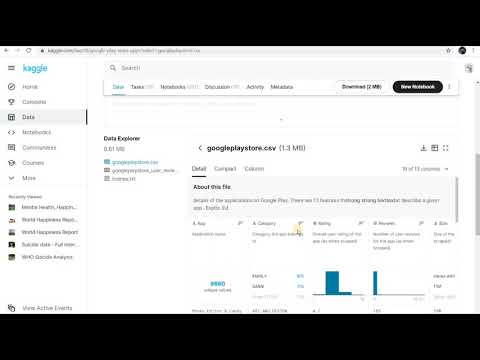
- Download
googleplaystore.csvfrom Kaggle. - Upload the file into your notebook using the provided code.
Step 3: Read and Inspect Data
- Read the uploaded CSV into a Pandas DataFrame called
all_app. - Perform basic checks:
- View the first 5 rows.
- Check
.info()to understand column types and missing data. - Check column names.
Sample Observations:
- 13 columns are present.
- Several columns are of object type even if they should be numeric.
:information_source: Milestone Checkpoint 1 :white_check_mark: Progress Check: You should now have:
- Successfully imported the dataset
- Viewed the data structure and column types
- Identified columns that need type conversion
:emoji: Part 2: Data Cleaning
Step One: Drop Unnecessary Columns
- Remove columns:
Size\`,Price, \`Content Rating,Genres\`,Last Updated, \`Current Ver, andAndroid Ver. - Save the changes using
inplace=True.
Step 2: Remove Duplicate Apps
- Check if the
Appcolumn has duplicates. - Drop duplicated rows based on the
Appcolumn.
Step 3: Handle Missing Values
- Check missing values across all columns.
- Remove rows with missing values in the
Ratingcolumn. - Validate that ratings are between 1 to 5.
- Special check: Remove any row where the rating value is not valid (e.g., rating = 19).
Step 4: Convert Columns to Correct Data Types
- Convert the
Reviewscolumn to integer type. - Clean the
Installscolumn:- Remove commas
,\` and plus signs+`. - Convert the cleaned values to integers.
- Remove commas
:bulb: Debugging Tip If you encounter errors when converting data types:
- Check for non-numeric values using
pd.to_numeric(errors='coerce')- Use
.str.replace()to remove special characters before conversion- Handle NaN values appropriately before type conversion
:emoji: Part 3: Export Cleaned Data
- Save the cleaned dataset as
cleaned_GPS_data.csv. - Download the cleaned CSV for future use.
:information_source: Milestone Checkpoint 2 :white_check_mark: Progress Check: You should now have:
- Removed unnecessary columns
- Cleaned duplicate entries
- Handled missing values
- Converted data types correctly
- Exported a clean dataset ready for analysis
:emoji: Part 4: Data Analysis
Step One: Upload Cleaned Data
- Re-upload and read
cleaned_GPS_data.csv\` into a DataFrame namedcleaned_data`.
Step 2: Basic Inspection
- View first 5 rows.
- Check
.info()and confirm column types.
Step 3: Clean Columns
- Remove the unnecessary column
Unnamed: 0.
:bar_chart: Part 5: Data Manipulation and Grouping
Objective One: Top 10 Most Installed Free Apps with Highest Reviews
- Filter the data to Free apps only.
- Sort the data in descending order by
Installs\` andReviews`. - Display the top 10 rows.
Expected Output:
- A table of the top 10 free apps based on installs and reviews.
Objective 2: Top 5 Categories by Number of Installs
- Group the data by
Category. - Sum the
Installsper category. - Sort the results in descending order.
- Display the top 5 categories.
Expected Output:
- A table listing the 5 most installed app categories.
:bulb: Common Errors & Solutions Error: "KeyError: 'Category'"
- Solution: Check column names with
df.columns- there might be extra spacesError: "ValueError: invalid literal for int()"
- Solution: Ensure all data cleaning steps were completed before analysis
Error: Empty results after filtering
- Solution: Check filter conditions and ensure 'Type' column contains 'Free' values
:chart_with_upwards_trend: Part 6: Data Visualization
Step One: Import Matplotlib
- Import the
matplotlib.pyplotlibrary.
Step 2: Create Bar Chart
- Plot a bar chart showing:
- X-axis: Categories (top 5)
- Y-axis: Total Installs
- Add:
- Title: "The Number of Apps Installed According to Categories"
- X-axis label: "Categories"
- Y-axis label: "Number of Apps"
Expected Graph:
- A simple bar graph displaying categories and their install counts.
:information_source: Milestone Checkpoint 3 :white_check_mark: Progress Check: You've completed the coding portion! You should now have:
- Identified top 10 free apps with most installs and reviews
- Found top 5 categories by install count
- Created a visualization showing category distribution
- All results ready for your report
:memo: Project 4: Google Play Store (Report Guideline)
You need to use the data "P4: Google Play Store (Part 2)" to make this report.
You need to make a copy of the "Report Template" as "[Your name] Google Play Store Analysis Report'' in your Colab Notebooks folder.
In general, the report will be divided into 4 components:
- Component 1: Cover
- Component 2: Overview
- Component 3: Results
- Component 4: Conclusion
Component 1: Cover
Cover of the report consists of:
- Logo: Already in template.
- Title: Already in template.
- Author information: Fill in your name and class slot.
Component 2: Overview
Overview of the report consist of 2 paragraphs:
- Background: Write about where you get the data, how you clean your data.
- Objectives: Write about what you want to study in this report(refers to your results)
Component 3: Results
This report consists of 2 or more results:
- Result 1: Top 10 most installed free apps with the highest number of reviews.
- Result 2: Top 5 categories with the highest number of installed apps.
Each result consists of:
- Table/Graph: Screenshot any useful tables and graphs from the project Google Play Store part 2.
- Observations: Write the observations that you can see in the table/graph.
- Reasoning: Find the reason for the thing observed.
- Support: Find resources to support your reason.
:bulb: Report Writing Tips
- Use specific numbers from your analysis (e.g., "Facebook has 974 million installs")
- Connect your findings to real-world trends
- Cite credible sources to support your reasoning
- Keep observations objective and data-driven
Component 4: Conclusion
Conclusion of report consists of 2 paragraphs:
- Summary: Conclude the results in short.
- Plan for next action: What is the action to be taken after knowing this report.
Extra Component: Reference
Write the title and link of the reference: e.g.
- Google Play, https://en.wikipedia.org/wiki/Google_Play
Click on the following link to access the Report Template:
Before you start writing your proposal, make sure that you:
-
Make 1 copy of the Report Template
-
Move the copy to your Colab Notebooks in Google Drive
-
The sample answer is for REFERENCE only. Write your sentence in the report. DON'T COPY the sample answer.
:emoji: Video Tutorial
Please download googleplaystore.csv from Kaggle before you start coding. Do refer to the video on how to download the CSV file.
:emoji: AI Prompts
Code with AI: Try using AI to assist with various aspects of the Google Play Store data analysis project.
Data Loading and Exploration:
- "Write Python code using Pandas to load the Google Play Store dataset from a CSV file named 'googleplaystore.csv'."
- "How do I display the first 5 rows of the Google Play Store DataFrame using Pandas?"
- "Generate Python code to get summary statistics (mean, median, etc.) for the 'Rating' column in the Google Play Store dataset."
Data Cleaning and Preprocessing:
- "Write Python code to identify and remove any missing values in the 'Rating' column of the Google Play Store dataset."
- "How do I convert the 'Installs' column to a numeric data type in Pandas, removing characters like '+' and ','?"
- "Generate Python code to remove duplicate entries from the Google Play Store dataset based on the 'App' column."
Data Analysis and Manipulation:
- "Write Python code to find the top 10 most installed free apps in the Google Play Store dataset."
- "How can I filter the dataset to only include apps in the 'FAMILY' category?"
- "Generate Python code to calculate the average rating for each category in the Google Play Store dataset."
Data Visualization:
- "Create a bar chart in Matplotlib showing the number of apps in each category in the Google Play Store dataset."
- "Generate Python code to create a scatter plot showing the relationship between 'Rating' and 'Reviews' in the Google Play Store dataset."
- "How can I customize the appearance (labels, titles, colors) of a Matplotlib chart?"
Google Play Store Data Analysis (Report Insights)
Code with AI: Try using AI to generate insights and refine your report.
Generating Insights:
- "Based on this data [DataFrame or summary statistics], what are some key trends or patterns in the Google Play Store market?"
- "What are the most popular app categories based on the number of installs?"
- "Generate a summary of the key findings from the Google Play Store data analysis."
Refining the Report:
- "Suggest ways to improve the clarity and conciseness of this paragraph: [paste paragraph text]."
- "Generate a concluding paragraph for my Google Play Store analysis report."
- "Proofread and edit the following text for grammar and style: [paste text]."
Exploring Further Questions:
- "What other factors might influence app ratings or installs, besides those analyzed in this project?"
- "Suggest further research questions related to the Google Play Store dataset."
:rocket: Extension Challenges
Ready to take your analysis further? Try these advanced challenges:
Challenge One: Advanced Visualizations
- Create a scatter plot showing the relationship between app ratings and number of reviews
- Build a heatmap showing install counts across different categories and content ratings
- Design an interactive dashboard using Plotly or Seaborn
Challenge 2: Statistical Analysis
- Calculate correlation coefficients between different variables
- Perform hypothesis testing on app ratings across categories
- Implement regression analysis to predict app success
Challenge 3: Machine Learning Application
- Build a classification model to predict if an app will be successful
- Create clusters of similar apps using K-means clustering
- Develop a recommendation system for apps
Challenge 4: Business Insights
- Analyze seasonal trends in app updates
- Compare free vs paid app performance
- Identify market gaps and opportunities for new apps
:memo: Pro Tip Document your extension work in a separate notebook section. This demonstrates initiative and advanced skills that can set your project apart!